Compare mitigation.
Evaluate scenarios, quantify uncertainty and compare changes in exposure to help choose where to act.
 Talk to our team
Stochastic Wildfire Impact Model (SWIM)
Recorded SWIM simulation · Berkeley, 21 October 2026.
Updated
SWIM success requires predictions that satisfy two conditions:
Condition (1) mandates that SWIM predict the correct burn areas, while condition (2) serves as a control mechanism to prevent arbitrarily large estimations.
Together, SWIM is judged on the accuracy and usefulness of its predictions.
SWIM accuracy is measured as the proportion of times both conditions are satisfied.
2D prediction & consequence modeling
See more than a fire perimeter. Examine possible outcomes alongside the buildings, communities and infrastructure they could affect.
P75 selected. 901.4 modeled acres.
Compare recorded outcomes
Compare saved P50, P75 and P90 outputs. All three predicted perimeters stay visible as you compare the heat maps and their modeled consequences.
Saved scenario · 21 October 2026
Explore live predictionsEvaluate scenarios, quantify uncertainty and compare changes in exposure to help choose where to act.
Forensic ignition analysis works backward from a burned perimeter to investigate candidate ignition locations.
Dynamic risk maps connect geospatial context to the infrastructure and communities that need attention.
Explore wildfire risk intelligenceFine-grained inputs.
A range of possible outcomes.
Most wildfire models operate on large grid cells. SWIM models use 0.2-acre polygons – allowing fine-grained accuracy that matters for risk modeling.
SWIM integrates wind speed and direction, temperature, humidity, elevation, fuel composition, moisture, and more. It’s powered by millions of wildfire records and terrain data.
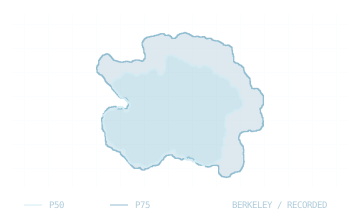
Instead of a single deterministic forecast, SWIM outputs a distribution of outcomes – critical for utilities, insurers, and emergency responders.
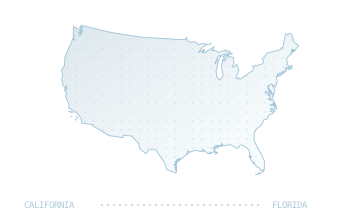
SWIM is built to scale. From California to Florida, SWIM can simulate fire behavior anywhere in the U.S. given an ignition point.
Applications of SWIM
The same wildfire scenario can inform different decisions. Start with the question your organization needs to answer.
Compare where wildfire could spread with the infrastructure and communities in its reach. Evaluate mitigation options and focus investment where it can make the greatest difference.
Test ignition scenarios, evaluate wildfire exposure and inform preparedness strategies. Use probabilistic outcomes to plan for a range of possible conditions.
Examine how potential fire spread intersects a portfolio. Support underwriting decisions, geographic accumulation management and comparison of mitigation strategies.
Use wildfire spread scenarios to compare protective measures for crops, livestock and working land.
Consider wildfire exposure alongside development, acquisition and risk-management decisions.
Case studies across four continents
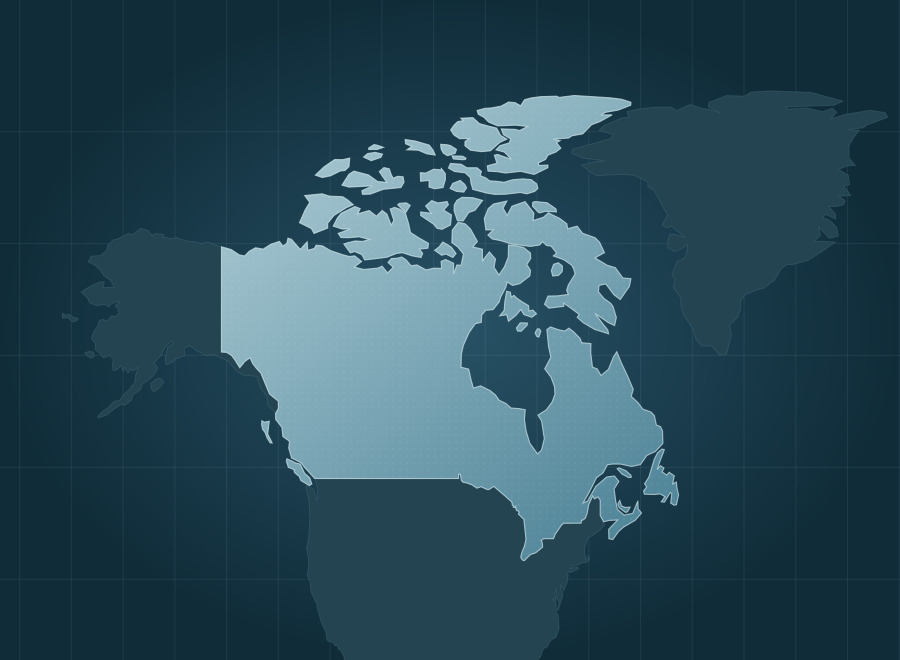
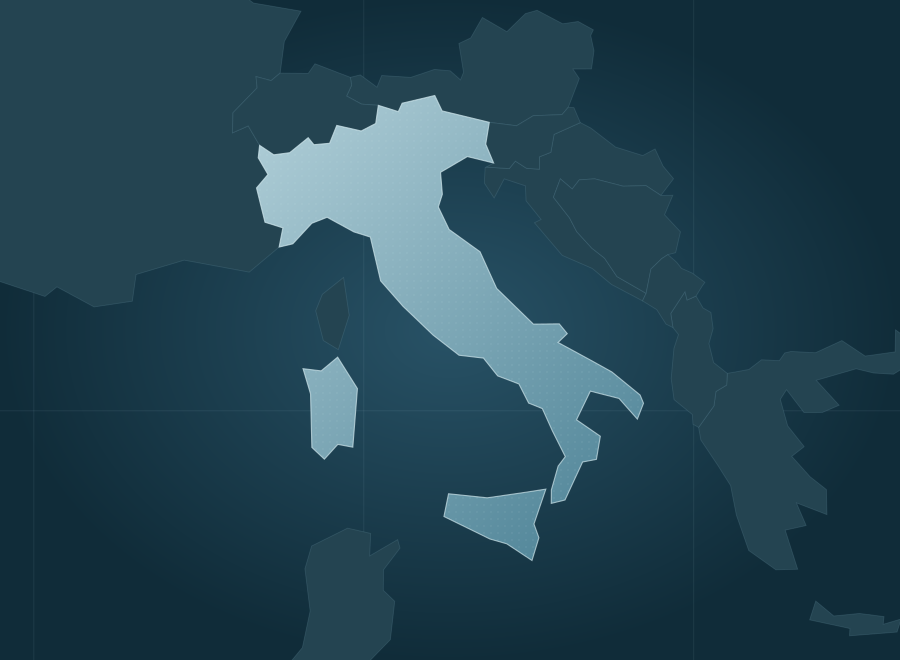
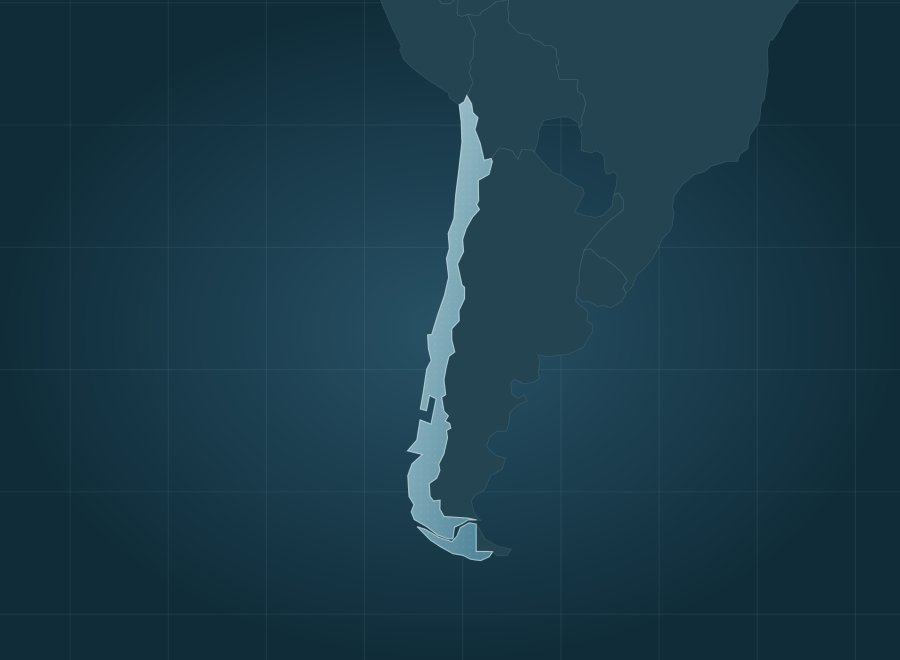
Explore ATS wildfire risk work in Australia, Canada, Italy and Chile.
Predicting Wildfire Like an Epidemic
We use the same mathematics that predict disease outbreaks to forecast the path of wildfire.
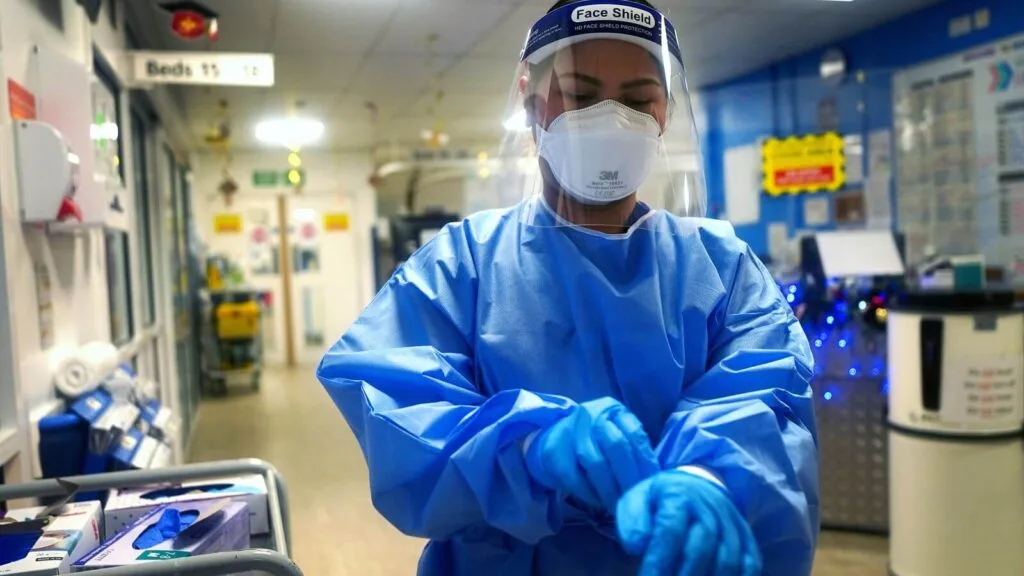
Stochastic epidemic spread model – widely
used by epidemiologists to predict disease
outcomes.
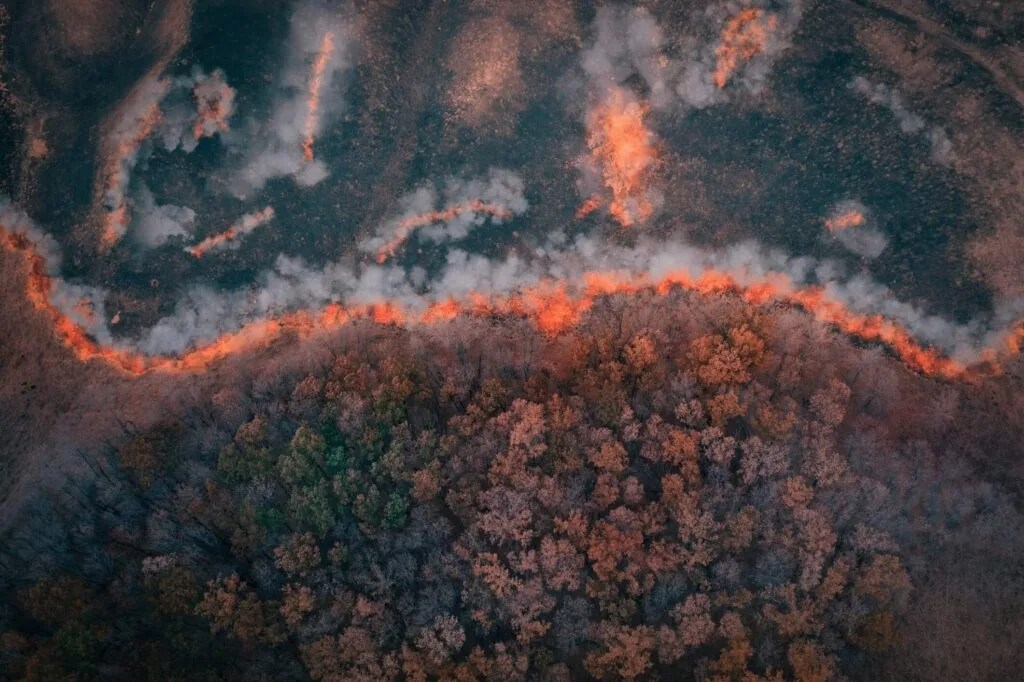
SWIM’s wildfire spread model – built using
similar stochastic dynamics and informed by
geophysical and weather data.
Because Wildfire Is Uncertain – Just Like Disease Spread
| Epidemic Models | SWIM Wildfire Models |
|---|---|
|
Use random sampling of disease
transmission likelihoods | Use random sampling of wildfire spread likelihoods |
| Factor in individual-level data (age, health, exposure) | Factor in geospatial data (fuel moisture, elevation, wind, slope, etc.) |
| Perform millions of simulations to build infection risk maps | Perform millions of simulations to build wildfire impact probability maps |