SWIM Chile 2026
Mapping Chile's wildfire risk. Quantifying what is at stake.
How ATS used its Stochastic Wildfire Impact Model (SWIM) to map wildfire risk across continental Chile, quantify expected economic and human consequences, and reveal why burned area has increased far faster than the number of fires.
Explore the model
Chile's interactive wildfire risk map
Explore modeled expected wildfire loss and burned area across Chile. Move between annual and daily views, inspect local risk tiers, and switch between burned-area estimates and financial consequences in Chilean pesos.
This map represents modeled wildfire risk, not a live incident forecast. The national risk surface covers 4,384,252 hexagons, each 250 meters per side (approximately 16.24 hectares). Map costs are displayed in Chilean pesos; this case study reports aggregate expected loss in US dollars. If the embedded dashboard does not display, open it directly in a new tab.
A new fire regime: bigger burns, not just more ignitions
Chile's wildfire burden has changed dramatically, but fire counts alone disguise the change. In the national CONAF record, annual area burned averaged 55,621 hectares in 1985–2014 and 162,675 hectares in 2015–2024. The number of fires grew by only 1.2×, while total area burned rose 2.9× and average fire size increased from 9.8 to 23.7 hectares.
Two extraordinary seasons, 2016–17 and 2022–23, account for 61% of all area burned in the latest decade. Even excluding those two seasons, the remaining eight average 78,432 hectares burned annually, about 1.4× the earlier thirty-season mean. ATS applied SWIM across continental Chile to connect ignition likelihood, uncertain fire growth, exposed communities and assets, and monetized consequences.
A fire count or hazard map cannot tell decision-makers where losses will occur.
Chile combines densely populated coastal and central communities, plantation forests, steep terrain and highly variable weather. The worst outcomes depend on whether an ignition becomes a large fire, which direction it spreads, and what lies in its path. Planning based only on historical starts or weather conditions can miss the probability of severe losses and the difference between hazard, exposure and consequence.
National risk intelligence built from ignition, stochastic spread and consequence.
ATS configured SWIM around Chilean fire records, weather, fuels, terrain, population and building footprints. Its workflow estimates daily ignition probability, a distribution of possible final fire sizes, probabilistic spread and four cost categories: human safety, structures, suppression and land restoration. The final national surface resolves expected risk to 4.38 million reporting hexagons, each 250 meters on a side.
What the Chile-wide analysis revealed
SWIM shows why Chile faces a substantially greater wildfire burden than its ignition counts suggest, where national expected losses concentrate, and how those risks translate into consequences for people, assets and land.
Long-run modeled national average in US dollars across structures, land restoration, human safety and fire suppression; not observed losses or an extreme-year scenario.
Mean burned area increased from 55,621 to 162,675 hectares annually, comparing 1985–2014 with 2015–2024; ignition counts rose only 1.2×.
The two highest national loss tiers account for 86% of modeled annual expected loss, highlighting a concentrated risk footprint.
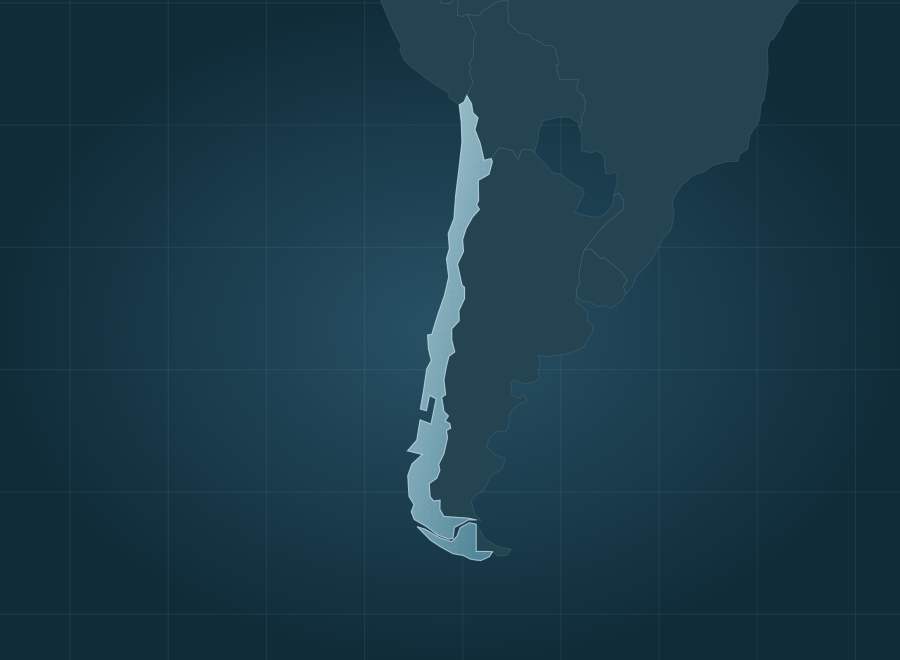
Continental Chile covered by 4,384,252 reporting cells, each 250 meters per side, with local daily and annual risk estimates.
The number of fires increased modestly. The area they burn almost tripled.
Comparing the three decades through 2014 with the most recent decade, annual fire counts rose just 1.2×, but annual burned area rose 2.9×. The average fire also became 2.4× larger. This divergence is why a credible risk model needs to estimate the distribution of fire sizes and downstream losses, not merely predict where fires will start.
9.8 ha per fire
23.7 ha per fire
Research foundation: SWIM's national estimate is 72,380 hectares burned annually, compared with the 40-season CONAF mean of 82,384 hectares, or approximately 88% of that benchmark. Estimated annual losses comprise $119.4M for structures, $41.8M for restoration, $23.9M for human safety, and $21.9M for suppression. The report illustrates fire-level reconstructions, including Santa Apolonia (2017) and El Carrizo (2014); these selected examples demonstrate model behavior and are not a population-wide statistical validation. National expected values are long-run modeled estimates, not observed costs. The report's research highlights were compiled in August 2026. Review the data, assumptions, historical records and fire-level results in the full Chile report ↗
What could probabilistic wildfire intelligence reveal about your region or assets?
Meet with ATS to discuss SWIM, our Wildfire Risk Analysis and Management (AWRAM) platform, and how tailored probabilistic analysis can help Chilean fire agencies, emergency managers, regional authorities, utilities and insurers prioritize preparedness, mitigation and investment decisions.