SWIM Italy 2026
Mapping Italy's wildfire risk. Quantifying what is at stake.
How ATS deployed its Stochastic Wildfire Impact Model (SWIM) across Italy's 20 regions to reveal where wildfires are most likely to cause harm, how severe their consequences could be, and why exposed assets alone do not determine risk.
Explore the model
Italy's interactive wildfire risk map
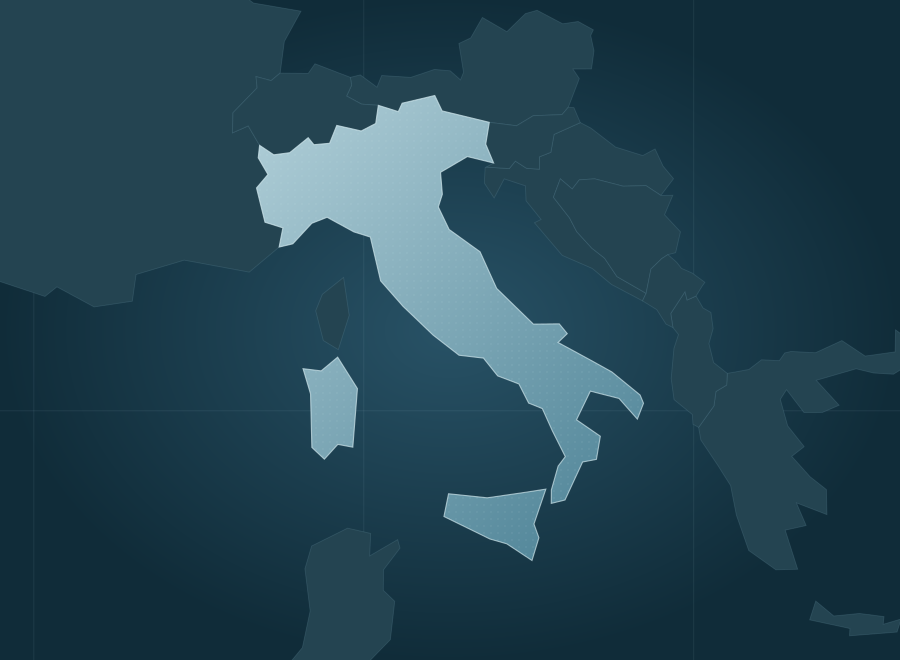
Explore modeled expected wildfire loss and burned area across Italy. Compare its 20 regions, inspect local risk cells, and switch between median and higher-severity fire-year scenarios.
This map represents modeled long-run wildfire risk, not a live incident forecast. Fire spread is evaluated on 20-meter hexagons and summarized in approximately 388,058 Italy reporting cells. If the embedded dashboard does not display, open it directly in a new tab.
One country, two wildfire seasons
Italy's wildfire patterns are sharply regional. Summer fires dominate the Mediterranean south and islands, while northern Italy experiences a distinct late-winter and early-spring fire season. From 2019 through 2025, Europe's EFFIS system mapped an average of 1,316 fires and 83,548 hectares burned annually in Italy; about 73% of recorded burned area occurred in July and August.
ATS applied SWIM across all 20 regions to look beyond fire danger and burned hectares. The model integrates local ignition likelihood, fuel, terrain, weather, assets and probabilistic fire spread, translating outcomes into expected economic loss. The resulting Italy risk surface ranks third among the 27 EU member states by modeled wildfire loss and accounts for approximately 14% of the EU total.
Fire weather and building exposure do not tell the whole story.
Italy's mountains, coastal settlements, farmland and Mediterranean forests experience different ignition patterns, fuel conditions and fire seasons. Areas with the most homes beside burnable vegetation are not necessarily the areas with the greatest annual losses. Decision-makers need to distinguish hazard, likelihood and consequences, rather than rely on a single weather index or historical fire perimeter.
European evidence. Twenty-meter spread. Monetized risk.
ATS configured SWIM using European fuel classification, terrain, satellite-derived fire progression, historic fire perimeters, weather and building exposure. Spread is modeled on 20-meter hexagons, then aggregated into 388,058 reporting cells. Fire-size probabilities are combined with exposed structures, people, land and suppression costs to generate location-specific losses in euros.
What the Italy-wide analysis revealed
SWIM shows how a country's wildfire burden can concentrate in a few regions, why asset counts alone do not determine risk, and how model uncertainty can be tested against fires on geographically withheld ground.
Long-run national estimate for structures and people, suppression and land, in 2025 euros, not observed annual damages.
Sicilia (€143M), Calabria (€92M) and Campania (€43M) account for roughly two-thirds of Italy's modeled annual wildfire losses.
Occupied dwellings sharing a reporting hexagon with burnable fuel, approximately 42% of the national dwelling stock.
Measured coverage across 15,360 European fires of 30 hectares or larger in spatially blocked, five-fold validation.
More exposed homes do not automatically translate to higher expected wildfire losses.
Lombardia has more than twice as many homes in the fire interface as Sicilia. Yet Sicilia's modeled annual loss is nearly 29 times greater, reflecting the combined effects of fire frequency, spread potential and consequences. Exposure is crucial, but it is only one part of risk.
1.63M homes in the interface
827 ha burned per year
720,041 homes in the interface
25,035 ha burned per year
Research foundation: The European SWIM fire-size model was trained on 156,080 European fires and evaluated using geographically separated validation; the Q90 result above comes from 15,360 held-out European fires and is not an Italy-only validation statistic. The Italy surface was built September 27, 2026. Figures are modeled long-run estimates in 2025 euros; expected burned area is approximately 63,276 hectares per year, versus 83,548 hectares per year in the observed 2019–2025 record. Review the methodology, sources and Italian historical fire comparisons in the complete report ↗
What could probabilistic wildfire intelligence reveal about your region or assets?
Meet with ATS to discuss SWIM, our Wildfire Risk Analysis and Management (AWRAM) platform, and how tailored analysis can help Italian fire agencies, regional governments, utilities and insurers prioritize preparedness, mitigation and investment decisions.