SWIM Australia 2026
Mapping Australia's wildfire risk. Quantifying what is at stake.
How ATS deployed its Stochastic Wildfire Impact Model (SWIM) across Australia to turn complex fire behaviour, landscape exposure and uncertainty into actionable, location-specific risk intelligence.
Explore the model
Australia's interactive wildfire risk map
Explore modeled wildfire exposure across the continent, change probability scenarios, and compare expected economic loss and burned area.
The map presents modeled long-run climatological risk, not a live incident forecast. If the embedded dashboard does not display, open it directly in a new tab.
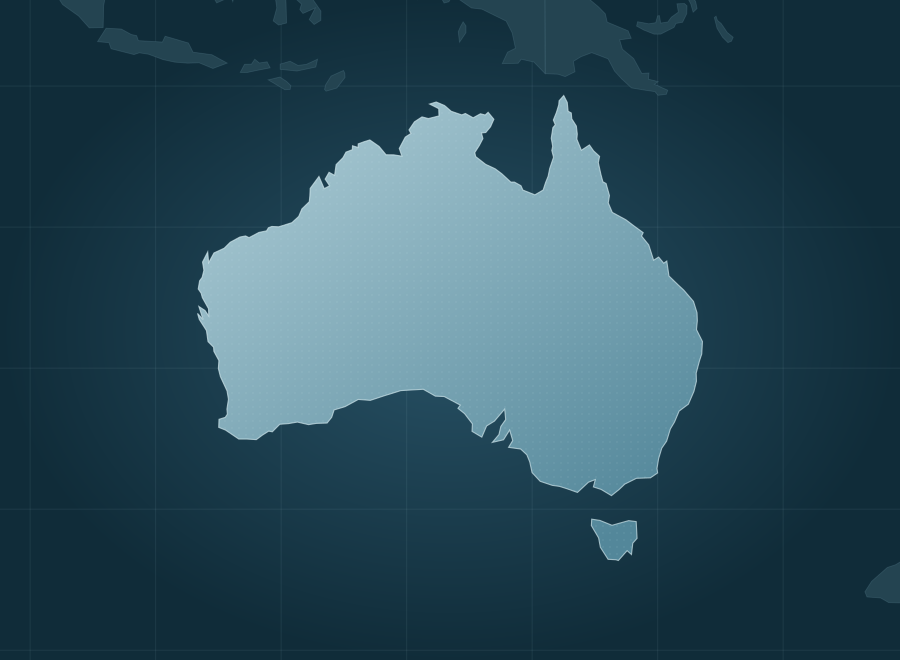
A national view of bushfire risk
Australia faces very different wildfire conditions across its vast landscape. Frequent northern savanna fires and less frequent, high-consequence fires in southern forests require different approaches to understanding and managing risk.
ATS extended SWIM across Australia to quantify both where fire can spread and what its consequences could be. The result is a nationwide, probabilistic assessment designed to help agencies, infrastructure owners and other decision-makers see beyond simple fire-danger maps.
Fire frequency does not tell the whole story.
Some regions burn across enormous areas but contain relatively little built exposure. Others burn less often yet face disproportionately high consequences when fire reaches communities or assets. A useful national model must account for both patterns, plus the uncertainty in how any individual fire may evolve.
Australian data. Stochastic outcomes. Monetized risk.
ATS configured SWIM with Australian fire-spread relationships, fuel classes, historical fire perimeters, weather, terrain, and exposure data. It simulates spread on 20-metre hexagons and aggregates results into approximately 10.8 million national reporting cells, estimating both fire-size distributions and probability-weighted economic losses.
What the nationwide analysis revealed
The results distinguish frequent burning from costly burning and reveal how national-scale uncertainty translates into risk for people, property and the landscape.
A national, long-run average estimate, not an observed annual loss total.
Illustrates the importance of evaluating less frequent, higher-consequence outcomes.
About 16% of dwellings represented in the national exposure model.
Observed final fire sizes below the modeled 90th percentile in geographically held-out tests.
More area burned does not necessarily mean greater loss per hectare.
The model estimates that Victoria's loss per burned hectare is approximately 12 times that of the Northern Territory, despite the Territory having a much larger annual share of its land burned. Fire behaviour and exposed value both matter.
Research foundation: The fire-size model was developed and tested using 157,933 mapped Australian fire perimeters (1898–2024), with geographically separated cross-validation. Figures above are outputs of the SWIM Australia national model built September 4, 2026; loss values are in Australian dollars and represent modeled risk, not verified damages. See the methodology and source datasets in the full report ↗
What could probabilistic wildfire intelligence reveal about your region or assets?
Meet with ATS to discuss SWIM, our Wildfire Risk Analysis and Management (AWRAM) platform, and how tailored analyses can support preparedness, mitigation and investment decisions.