SWIM Canada 2026
Mapping Canada's wildfire risk. Quantifying what is at stake.
How ATS deployed its Stochastic Wildfire Impact Model (SWIM) across Canada to turn complex fire behaviour, landscape exposure and uncertainty into actionable, location-specific risk intelligence.
Explore the model
Canada's interactive wildfire risk map
Explore modeled wildfire risk across Canada, compare expected economic loss and burned area, and switch between average and higher-severity fire-year scenarios.
The map presents modeled long-run climatological risk, not a live incident forecast. Coverage is for Canada south of 70° north. If the embedded dashboard does not display, open it directly in a new tab.
A national view of wildfire risk
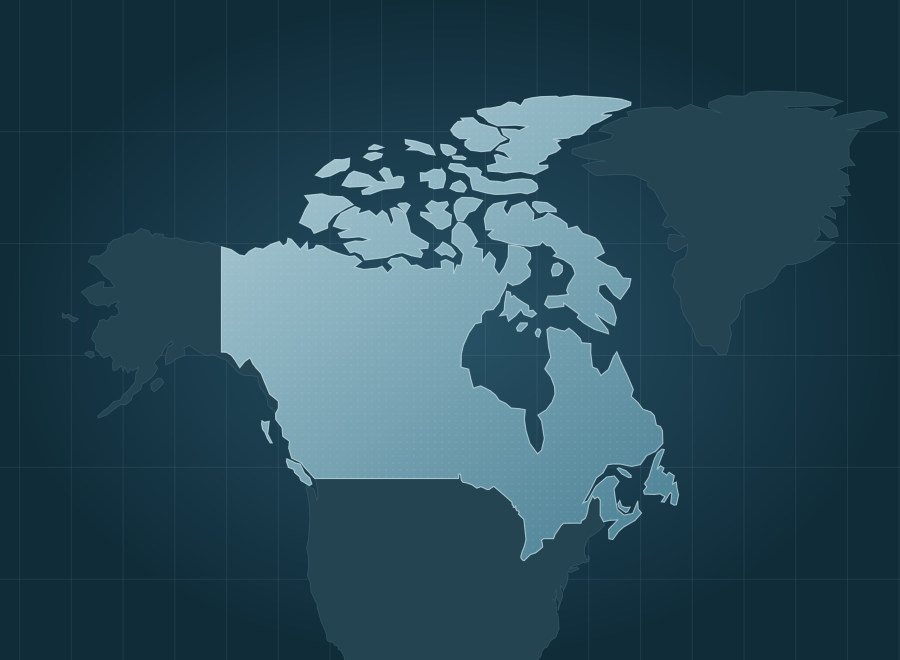
Canada's wildfire environment spans dense boreal forests, northern landscapes, Prairie grasslands and communities at the edge of burnable vegetation. Lightning-driven fires account for most of the area burned, while the potential consequences vary considerably by location.
ATS applied SWIM across Canada south of 70° north to assess not only where fires might start and spread, but also how often an area may burn and what the resulting losses could be. The result is a nationwide, probabilistic view designed to help emergency managers, governments, utilities, insurers and landowners make better-informed risk decisions.
Burned area is not the same as economic risk.
Lightning causes approximately 48% of recorded ignitions but 87% of burned area. Remote regions can burn extensively, while fires near communities and valuable landscapes can create greater economic consequences even when less land burns. A useful national model must evaluate ignition likelihood, potential spread, exposed value and uncertainty together.
Canadian data. Stochastic outcomes. Monetized risk.
ATS configured SWIM with Canada's Fire Behavior Prediction System, national fuel data, historical fire records, weather, terrain and exposure information. Fire spread is simulated on 20-metre hexagons and translated into approximately 11.4 million national reporting locations, combining fire-size distributions with probability-weighted economic consequences.
What the nationwide analysis revealed
The model distinguishes regions that burn frequently from regions where burning produces the greatest expected losses, while putting a measurable range around more severe fire years.
Long-run national estimate across land, suppression, structures and people, not observed annual damages.
Modeled national loss in a high-severity annual scenario, compared with CA$4.69B at the median.
Homes in or alongside burnable landscapes, from roughly 16.0 million dwellings nationally.
Observed fires at or below SWIM's modeled 90th percentile across 9,922 fires of at least 30 hectares in geographically held-out tests.
More land burned does not necessarily mean a larger economic loss.
The Northwest Territories have almost 2.8 times British Columbia's modeled annual burned area. Yet British Columbia's modeled expected annual loss is approximately 71% higher. Comparing hectares alone can obscure the significance of exposed land value, assets and suppression costs.
843,636 hectares burned per year
302,025 hectares burned per year
Research foundation: The Canadian fire-size model draws on 257,192 fire records (1972–2025) and was evaluated against 9,922 recorded fires using geographically separated cross-validation. Figures reflect SWIM Canada model outputs built October 8, 2026; monetary values are in 2025 Canadian dollars and represent modeled risk, not verified damages. See the methodology and source datasets in the full report ↗
What could probabilistic wildfire intelligence reveal about your region or assets?
Meet with ATS to discuss SWIM, our Wildfire Risk Analysis and Management (AWRAM) platform, and how tailored Canadian analyses can support preparedness, mitigation and investment decisions.